Let us refresh ourselves on the Fibonacci numbers, ratio, retracements and extension.
The Fibonacci series of numbers are:
1,1,2,3,5,8,13,21,34,55,89…..
The numbers are calculated by adding the two previous number:
Example: 3+5=8
5+8=13
8+13=21
The 38.2% ratio is found by dividing one number in the series by the number that is found two places to the right. For example: 55/144 = 0.3819.
The 23.6% ratio is found by dividing one number in the series by the number that is three places to the right. For example: 8/34 = 0.2352.
The square root of 0.618=0.786, (0.764 or 38.2 x 2 is more widely used Fibonacci ratio in forex analysis as currency bounced more often at this level)
The above ratio with the 0.0 (0%), 0.5 (50%) and 1.0 (100%) ratios constitutes the Fibonacci (fibo) retracements or correction.
When a market makes a move from a low to a high, prices have a tendency to pull back or correct. The percentage of the pullback is normally at the above fibo ratios.
The figure below show the correction or retracement point C is the percentage of the distance from point A to point B. Once retracement is completed, the market is reversed and continues in the direction of the initial trend.

There are also fibo ratios above 1.0 or 100%. The two common Fibonacci ratios above 1.0 are 1.618 and 1.272.
The ratio 1.618 or 161.8% is derived from dividing one number in the series by the previous number eg. 34/21 or 55/34.
The ration 1.27 is derived from the square root of 1.618.
The following ratios are also important fibo ratio abiove 1.0:
The square number of 1.618 is 2.618 or 261.8%.
4.236 ratio is from multiplying 1.618 with 2.618
The above ratios are referred as fibo extensions. Extension is when a pullback that retrace beyond the original starting point and exceed 100 percent of the initial wave or trend. It is essentially a correction that exceeds the low of the nitial trend.
The figure 2 below, is the fibo extension. Technician will use the 100%, 127.2%, 161.8%, 200%, 261.8% and 423.6% to target a pullback level; and we can see that correction exceed the low point A, we see raids on stop.

Some technicians referred the figure 3 below as fibo extension. For me it is not a fibo extension but a fibo projection which is simply potential price objective and a vital component in Elliot wave theory. It is a confirmation tool to identify potential trend-exhaustion turning points. In the figure 3, the bullish upside objective is measured by the swing of A to B and multiply that sum by corresponding ratios, which are 0.618%, 1%, 1.618%, 2.618% and to the extreme of 3.618%. Add the figure to a low point C. sometimes we could also add the figure to the top of point B.

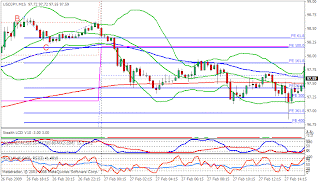
Let brush through the fibo retracement and extension during the Asian session up to the opening session in US on 27th February i.e. the last day of February trading session of USDJPY. The chart is a 15 min TF.
The red horizontal lines are the fibo retracement and extension from the swing low at A to swing high at B , while the blue horizontal lines are the fibo retracement and extension from swing low of C to swing high at D.
Since the Australian session, the cross is moving southward and tested the swing low
of C. It consolidated at this level for about 45 mins before breaking that level to rest at 200% extension and 61,8% retracement.


