Sunday, May 30, 2010

Ringgit's MACD histogram

A MACD Histogram divergence and a rejection from the uptrend line confirmed last weak reversal of USDMYR uptrend that originated two weeks ago.

The coming weeks, USD/MYR has to cross over the 50% retracement at 3.2687 and then penetrated and close below the 61.8% at 3.2542 to validate the reversal to short position.

On the upside, a resistance at 61.8% retracement i.e. at 3.3337 (the red color fibo) has to be overcome before the previous high at 3.3676 being tested.

Ringgit and risk sentiment

According to National Australia Bank Ltd, Asian currencies will lose half their gains made since the easing of the 2008 global financial crisis as Europe’s debt woes cause a “double-dip” in global stock markets. Investors will sell riskier assets as the European Union seeks a solution to its debt woes and tensions mount on the Korean peninsula but with China denied rumors of reviewing European debt holdings and the State Administration of Foreign Exchange reaffirmed eurozone as "one of the most important investment markets" and consequently risk sentiments staged a strong recovery by the end of the week. DOW managed to extend the rebound from intraday low of 9774 and close above 10,000 level at 10136. Major currencies were generally higher against dollar and yen, in particular commodity currencies. However, Euro failed to benefit from the recovery in risk appetite and has indeed closed lower against other major currencies.

The ringgit movement against the dollar has been in-sync with the local stock market as measure by FBM KLCI.

The two charts below showed the month of May for USD/MYR at the top and FBM KLCI at the bottom. Although the ringgit has not moved as drastic as the local bourse but both moved in the same direction.


USD/MYR


FBM KLCI

Looking at DJIA and EWM (the two charts below), it provided us more clear picture the relationship between New York bourse, the local bourse and the ringgit and EWM demonstrated more sensitivity to the ringgit.


DJIA


EWM


As for the EUR/USD, it is more reflected by the US Dollar Index with the ringgit following tentatively the US Dollar Index. (refer to EUR/USD and US Dollar Index below).

US DOLLAR INDEX

EUR/USD


The US Dollar for the entire week was defined by high volatility otherwise bound by congestion - even though most benchmarks (like EURUSD and the Dow Jones Industrial Average) remain on the verge of establishing the next leg of a major bear trend.

US and UK markets (meaning banks and exchanges) will be offline this coming Monday. On tap for the risk-sensitive market that was unseen before, announcement near the close of the London trading session, Fitch Ratings unexpectedly downgraded Spain’s sovereign debt rating one step from a top AAA to AA+. Given the level of debt, unemployment and austerity cuts Spanish economy faces, such a move is not a complete surprise. However, as we have seen time and again; when sentiment is already weakened, discouraging developments like these simply feed the fire.

The development in stocks, i.e the DOW another attempt to break through 10,000 level last week and even breached Feb's low of 9835 briefly and buying quickly emerged that sent stocks higher towards the end of the week. However, the recoveries looked corrective. Also, Friday's selloff argues that recoveries might be over. Traders could be cautious on renewed pressure on stocks on Monday and on Tuesday when US and UK market returns. There is a number of important US economic data for next week:

1. American Unemployment Claims: Published on Thursday at 12:30 GMT. This weekly barometer is usually a better indicator. During most of this month’s weeks, it stood around 440K, signalling a positive NFP. Unemployment claims stood on 460K last week. A drop below 430K will raise expectations, while a rise above 480K will be very disappointing.

2. Non-Farm Payrolls: Published on Friday at 12:30 GMT. The most important indicator in forex trading was superb last month – it showed that the American job market gained 290K jobs, far better than 198K that was predicted. Also the previous month’s number was upgraded to 230K. On the other hand, the unemployment rate jumped from 9.7% to 9.9%, avoiding double digits, but still causing worries. The government’s decennial census will have a strong impact this time – a gain of 465,000 jobs is expected. On the other hand, the unemployment rate will probably only edge down to 9.8%. This release always creates choppy trading that begins many hours before the release and lasts until the closing bell.

Friday, May 28, 2010

Profit taking during Asian session

5 MTF

1 MTF


Yesterday GBP/USD was on the uptrend before heavy selling pulled the pair down to about 30 pips above Tokyo session low two hours before and after New York open. Then the pair or cable moved aggressively upward and close at around the day high of 1.4606. With a day low of 1.4366, in early Asian session before London open I expected cable to experience profit taking with support at 38.2% (1.4514)

retracement of a swing for previous day's low to high.

Today, in early Asian session, cable was sliding within a descending channel and at point II the pair showed sign of reversing as it almost touched the lower channel line and being above the daily pivot point with a divergence in MACD.(refer to the 5 MTF chart).

Referring to the 1 MTF chart, I made a buy entry at point A. Drawing a fibo retracement of point I and II on the 5 MTF (the red color line fibo), and following the retracement I foresee that the move upward will be fast and above the swing high. The resistance levels above the swing high is 1.4585 i.e. the mid-point of daily pivot and pivot resistance R1 and Asian session high of 1.4589. At this time about 6.50 GMT there was a rumour on-line of sell orders at 1.4590/00.

Drawing a parallel line from two low points, an ascending channel was formed with area around 1.4590 as the second point of the upper channel line. I took this point as my exit of my long position. `At the turn of the top at this level a divergence of MACD Histogram is seen therefore my second entry with a short position. The entry was done based on the 1 MTF chart at point B. Extracting a fib retracement from low at II to high at III(5 MTF chart with green dotted fibo line), at 50% retracement price penetrated the lower channel line (point C at 1 MTF chart) with MACD histogram crossing the zero line( i.e. negative MACD or MACD line cross over the signal line from above).

By tracing the lag and MACD of 5 MTF, I exited at 34% below the swing low and high.

Wednesday, May 26, 2010

Risk aversion reversal

5 MTF
1 MTF

Yesterday GBP/USD slide to a three day low of 1.4269 in early London session before recovering aggressively and close for the day higher than the opening price at slightly above 61.8% retracement of three days swing high at 1.4527 and swing low of 1.4259. An upbeat economic reports in UK and US effected a risk aversion reversal sentiment with stock market in New York rebounded strongly in late session.

With resistance at 61.8%, I expected early Asian session cable to slide down on profit taking. In early Asian session, cable slipped downward under the downtrend 1(5 MTF chart) before finding support at 1.4362(at 32.8% of three days swing). Price corrected within the uptrend line 2 and I extract a fibo retracement of point i to point ii as S&R for my scalp trade for today.

My first trade is a long position at point A with MACD divergence, a strong support level at 1.4350 and positive indicators. At point A there is a penetration of upper resistance line of declining channel 3. Exit the position at B at resistance round number 1.4400, 61.8% retracement and the diagonal resistance of uptrend line 2(see 5 MTF).

With reversal at 61.8% I expect cable to at least retrace back to the swing low and my short entry is at point C with negative indicators.

Tuesday, May 25, 2010

Risk aversion impinge on Cable

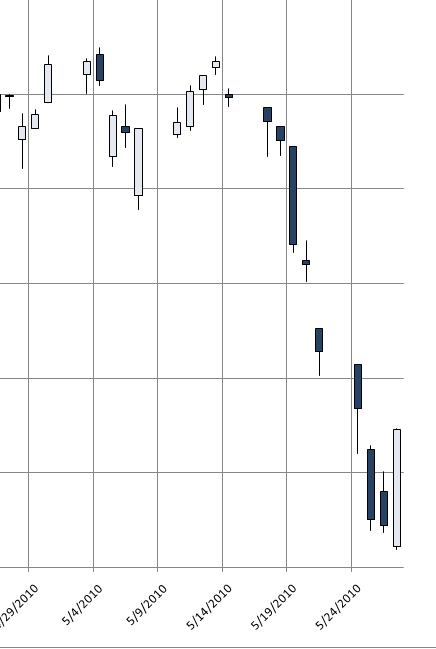
Risk aversion was the main theme since yesterday in forex market as cable or GBP/USD was stop from going higher by the descending 200 hours EMA and a long term 19.1% fibo retracement at 1.4477 and the hourly resistance at 1.4493 yesterday as the fall continue. A subsequent price correction occurred during late New York session which was being capped at 61.8% fibo retracement of the day's high at 1.4527 and low at 1.4351.

Early Asian session today, saw the pair being pushed downward breaching the support of previous day low and there was a dead cross between the 20 SMA and 60 EMA. (refer to the 1 HrTF chart above).

A swing high of 1.4409(point 1) and low of 1.4336 (point 2) before the Europe/London session will be used to extract my support and resistance level form my trading.(refer to the 5 MTF chart below)

Thirty minutes before Frankfurt open, the pair penetrate the previous day low and the intermediate price swing's fibo 19.1% retracement and formed a downtrending channel(brown color). Prices than consolidate between resistance level at 1.4345 and support at 1.4327.

On 1 MTF chart, my first entry is a sell at point A (note: this is a downtrend, a lesser risk by taking a sell position) by fading the top of the channel and resistance line 1.4345. My exit is point B at lower channel and 34.0% below the swing low.

Second entry is for buy at C i.e. fading the support line with lag crossing above 15 and MACD positive. There is also a divergence in RSI (refer to 5 MTF chart ) Target will be lower pips since the trend is still downtrend. Exit at D with resistance of upper channel line and 200 EMA.

The third entry is at E, fading the resistance with red lag crosing 85 from above and MACD negative. Target is expected at 55% below swing low or at 38.2% extension.


5 MTF

1 MTF

Monday, May 24, 2010

Cable to trend sideway

GBP/USD bounced back from a fresh yearly low of 1.4231 on Thursday and moved within a tight range of 70 pips on Friday. With the pair is still unsure of how to react to the news of looming budget cuts or BA strike the Asian session and early European session is expected to trend sideway.

On 1HrTF chart, cable at the first three hours of Tokyo session drifted downward before finding support at 1.4427(38.2% retracement) and hourly support at 1.4416 and pivot point(1.4439). Above the resistance level is at previous day High at 1.4495.

1 HTF

On the 5 MTF chart, my trades are as follows:

1. Entry at Point A with a resistance level of previous day high at 1.4495 on a sell position and MACD divergence. Exit and reverse at point B (support of 50%-1.4455 and 19.1%-1.4460).

2. At point C, exit and reverse (similar reason as point A) and exit at Point D on support of 60 EMA, major support line at 1.4475 and 19.1%-1.4478. At point D a reversal entry was also made.


5 MTF

Saturday, May 22, 2010

Cable testing the top of consolidation range of 1.4230 to 1.4500

At Tokyo session, GBPUSD opened at 1.4392 with daily pivot at 1.4361, resistance 1 at 1.4489 and support 1 at 1.4263.

Fibo support and resistance level :

1. 4 1. 4 HrTF: 1.4386 (19.1%)

2. 2. Current : High- 1.4454 and Low-1.4328

- 1.4406(38.2%)

-1.4391(50%)

-1.4376(61.8%)

3. Previous Day: High-1.4457

-1.4371(38.2%)

-1.4344(50%)

First entry at point A with a buy on support of MA: 60 EMA(5 MTF) and 365 EMA(1 MTF), Opening price and 1.4391(50%).

Exit and reverse at point B with RSI and MACD divergence (5 MTF), resistance of previous day high and round number 1.4450.

Exit my second position at point C with support of 365 EMA (5 MTF), daily pivot and major support level of 1.43637 with divergence of MACD Histogram (5 MTF).


5 MTF

1 MTF

FBM KLCI and Ringgit moved in tandem

Previous week announcement of improvement of the Malaysian econmy and Bank Negara raising the OPR has no bearing on the Ringgit this week.

USDMYR rose up for a five days and negated last week fall, and and posted its biggest weekly loss since 1998, as regional stocks slumped and traders pared bet on future appreciation of the Chinese Yuan.

The Ringgit slide was in line with other currencies in Asia, where currencies of Japan and Europe strengthened against the US dollar.

The Ringgit, Singapore Dollar and South Korean Won against the US Dollar-showing weakness since early of the week while the US Dollar Index reached the Top on Tuesday and went south for the next three days.

USDMYR

SGDUSD
KRWUSD


The Ringgit weakness took a cue from sentiment in the local equity market. The equity market as represented by FBM KLCI has been on the slide since last Friday with Ringgit moving in the same direction.

The chart below showed a comparison between FBM KLCI and EWM. EWM is an Exchange Traded Fund (ETF) that is meant to track the MSCI Malaysia Index, the iShare MSCI Malay sian Index Fund that is listed on New York stocK Exchange. As an index fund, EWM seeks to track the performance of an Bursa Malaysia index by holding in its portfolio either the contents of the index or a representativ e sample of the securities in the index.

We could see that FBM KLCI movement is precede by the New York Stock Market as represented by DJIA below.

FBM KLCI (top) and EWM (bottom)

DJIA

The USDMYR has been on the move upward but the sentiment is still on the bearish side as the pair has not tested the 61.8% retracement at 3.3458. The coming week I expected the pair to test the 3.3458 and 200 EMA. Penetration at this level will be met with resistance at 50% retracement.

Failure to penetrate 3.3458 level will had a support at 3.300.


Sunday, May 16, 2010

Bank Negara raised the OPR to 2.5 percent

The impact of European Zones sovereign debt crisis is relatively muted on Malaysia, as the US Dollar appreciation was heavily influenced by underlying sentiment in Europe but the USDMYR is seen moving downward.

The pair which went to the top at 3.2996 on Friday(7th May) of the previous week went tumbling down to a minor support at 3.1813 on Tuesday(11th May). There was a minor rally to the 50% retracement by the middle of the week before closing lower by the end of the week to the above the minor support at 3.1813.

The heavy fall for the pair was partly attributed to the expected announcement by Bank Negara raising the Overnight Policy Rate (OPR) by 25 basis points to 2.50 per cent. The decision follows Malaysia’s economic expansion of 10.1 per cent for the first quarter of this year, the country’s first double-digit growth in 10 years.

Malaysia was among the first Asian countries to withdraw monetary stimulus this year, calling its move a “normalization” of rates rather than policy tightening. The Bank Negara’s rate increase in March was the first in almost four years.

Faster growth in Asia is causing central banks in the region to withdraw monetary stimulus through interest-rate increases and the withdrawal of excess cash in their financial systems.

India and Vietnam have raised borrowing costs to contain inflation, while China has ordered banks to set aside more reserves three times this year to avert asset bubbles.

Loking at the 1HR chart of the pair(see the chart below), the pair is under pressure to move further downward as the 60 and EMA had a dead cross on Thursday with RSI and MACD is at oversold position. I am looking for the pair to move to the next support at 3.17 but breaching the 50% retracement will indicate a short term bullish tone.


Friday, May 14, 2010

Cable pressured by BOE and Trade Balance Report

Cable is still feeling the pressure from Wednesday's dovish BoE quarterly inflation report. The disappointing trade balance which showed deficit widened to GBP 7.5 billion in March, put a lot of pressure on the GBP/USD pair. By the end of Thursday session the pair has bottom at 1.4571.

Friday early session started with a possibility of a reverse head and shoulder pattern with Thursday’s low as the bottom of the reverse head. The pair than stride upward within a uptrend channel(refer to 5 MTF chart below). By Tokyo Lunch time, a toppish double top is forming at 50% fibo retracement.

My first entry with a sell position was at point A(refer to 1MTF and 5MTF charts below). The 5MTF showed a divergence in RSI and MACD while on 1MTF there was a penetration of uptrend line and all indicators showing a sell position. Target was at previous day low at 1.4571.

Second entry with a buy at point C with indicators at 5MTF and 1 MTF showing a buy signal. Target at D with resistance of the uptrend line, 200 EMA(5 MTF) and 50% fibo retracement.

5 MTF CHART


1 MTF CHART

Thursday, May 13, 2010

No news is good news

It has been a very quiet trading session in Asia on Thursday with most of the majors trading in 40-50 pip ranges. Cable seem to have taken a break after some massive movements in the last few days as there was no news reports emerged from the new Prime Minister, David Cameron and no news is always good news for cable.

GBPUSD has inched upward from the low showing higher highs and lows since early Asian session.

Drawing from 5 MTF chart (refer to the 5 MTF above), the pair has moved pass the 61.8% fibo retracement thrice but bounce of the 365 EMA. At point A, the pair bounced off the 365 EMA but the 61.8% fibo managed to support the price from falling further. At this level I make a long entry with blue lag moving pass the 15 level, RSI moving away from 50 level and MACD crossing the signal line from below. Exit is at point B when prices touched the daily pivot and 155% extension.

At around point B, with prices fading from the pivot and 1.4900 level a short position was taken with target price at Asian support(1.4815)

Wednesday, May 12, 2010

Support at 50% retracement

Cable went toppish at London Close yesterday and it drifted downward to support level at 1.4910 and the 365 EMA. (refer to the 15 MTF Chart below). It rebounded to 1.4960 on Tokyo open before drifting down to 1.4880.

Cable again had a smaller correction before finding support of 50% retracement of previous day high and low at around Tokyo lunch time. The weekly Pivot of 1.4970 also provided support. At this level , I took the opportunity to initiate my trade for the day because it is about 30 minutes before Frankfurt open.


I refer my trade on the 5 MTF chart (see the % MTF chart below) and the entry on 1 MTF chart.

My first entry was at A for a buy position. Exited half of my position at B with 30 pips profit. Make another entry for buy at C and exited my overall position at D (Asian session high).


Monday, May 10, 2010

Back to previous month level

As expected USDMYR reversed downward on Monday. The drop was substantial that it negated the whole of last week gain. Referring to the MACD, RSI and the lag, the pair still has the momentum to move further downward. The immediate support is at 3.17 and any break of this level the next support is at 3.10.

With EU announcing USD750 Billion fund for to prevent spreading of sovereign debt crisis in the region, risk aversion sentiment is expected to be contained and the US Dollar upward moved curtailed.

Saturday, May 8, 2010

Risk Aversion and USDMYR

Since early April, USDMYR has been trotting along the descending channel A-B, and on Tuesday the upper resistance line was penetrated. The penetration occurred with a golden cross of 20 and 89 EMA. Price manage to penetrate the 200 EMA on Thursday as US dollar strengthened upon investor’s sentiment for risk aversion with stock markets plunged downward. Friday with an expected favorable employment figure in US pushed the pair above 365 EMA.

The penetration of the upper resistance line met the target price at 3.2714 and by the end of the week the pair reached the 61.8% fibo retracement.

Putting the last three days ‘ uptrend, we are witnessing a natural correction following an aggressive downward `trend of the pair since last February.

This coincided with the greenback’s impressive rally through the first four sessions of the week – representing the best run for the benchmark since the sharp reversal back in mid-December. But on the last day of the week, the greenback on a daily basis, the dollar’s performance was disappointing. If we were to ignore the events of the rest of the week, the currency suffered its biggest net loss in two months.

With USDMYR currently at overbought position I expected the pair to test support at 3.25. The next support is at 3.20. Any break above 3.30 is expected to meet resistance level at 3.34

Sunday, May 2, 2010

Non-Farm Payrolls Report and USDMYR

USDMYR pair is moving along the channel A-A1 and B-B1 for the past 4 weeks. The movement of USDMYR was in line with other Asian currencies against the US Dollar such as the SG Dollar and KR Won.

On the daily chart, USDMYR has been bouncing against the 20 SMA and the MACD has cross over the trigger line since three week ago but the overall picture is still bearish with lower high and lower low. We are looking for a break of the support at 3.17 for a move toward 3.15. Any break upward will not alter the bearish stand.

On the fundamentals for the coming weeks the US Nonfarm Payrolls (NFP) data will be the has a major influence on the US dollar but the preNFP reports will aslo be a factor.yment report. First on the block will be ISM Manufacturing report. Any surprises in said number could color expectations for historically market-moving ISM Services data due just two days later.
Wednesday’s ADP Employment and Challenger Job Cuts data could likewise color forecasts for what promises to be a contentious NFP release.
US Dollar bulls should hope that the economy added jobs for a second consecutive month, and it would be the first such occurrence since December, 2007. With so much riding on the release, any especially large surprises could easily set the tone for US Dollar trading in the days to follow. Traders will certainly wonder whether the all-important US labor market has truly turned the corner and if consumer spending can recover through the second quarter.

Live Economic Calendar Powered by the Forex Trading Portal Forexpros.com