Wednesday, August 24, 2011

Good buying support

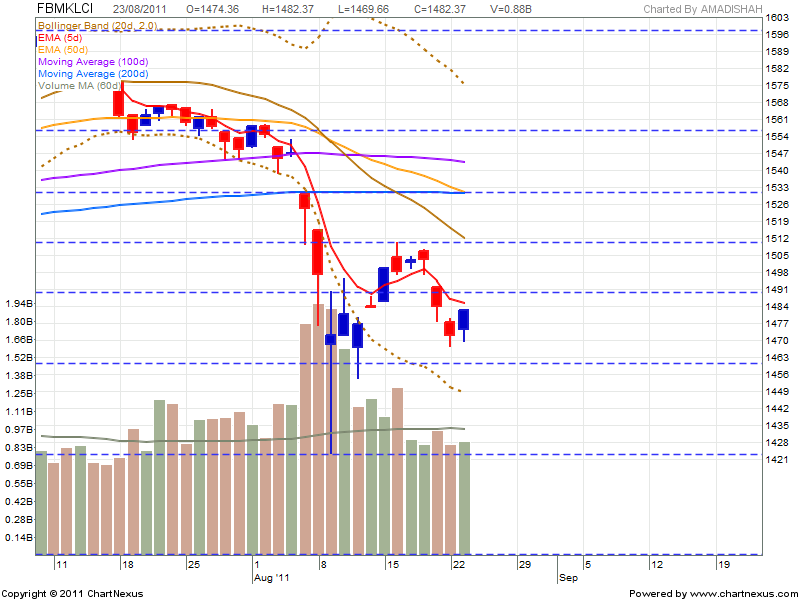
The index open gap up just above daily Pivot point implicating a bullish day, It did found support at t daily S1 before reversing to uptrend to close at day’s high just below daily R2. The bullish tone printed a bullish candle with a short lower tails indicating substantial buying support. Yesterday, volume was quite low with retailers and local institutions were net buyers. Today volume traded improved from yesterday.

The index as expected has moved above 1475. Tomorrow I am expected the buying support to continue and it will able to close above the 5d MA unless there is negative factors emitting from US and Europe.

Tuesday, August 23, 2011

Support at 1475.


FBMKLCI opened with a gap down at Daily S1. It went higher in early session but could not penetrate the daily pivot point and consequently it moved south to daily S3 level. The bearish sentiment resulted in a sold/black candle with a short shadow reflecting not much buying support.

FBMKLCI just managed to close below the support level of 1475 but well above the weekly S1 level, for the next 1-2 days the index is expected to cross over the 5d MA and retesting the 1475 level again.

Monday, August 22, 2011

Testing the low of 1423


Dow FBMKLCI
Date % Point % Point
12/8/2011 1.13 125.71
15/8/2011 1.90 213.88 0.84 12.47
16/8/2011 (0.67) (76.97) 0.14 2.10
17/8/2011 0.04 4.28 0.32 4.83
18/8/2011 (3.68) (419.63) 0.02 0.23
19/8/2011 (1.57) (172.93) (1.29) (19.32)

Last week only the overnight Thursday negative performance of the Dow has an negative effect for FBMKLCI on Friday.

Chartwise, the 50% FR at 1510 acted as resistance for the pullback of the down trend. Tuesday and Wednesday candles formed a bullish doji cross harami but Thursday gap opened could not penetrate the 50% FR and formed a bearish hangman candle.

Friday with Dow performing badly overnite and there was a gap down on the open.The open was at around daily S2 and FBMKLCI could not push above it and went below the 5d MA.It found its low at weekly pivot and monthly S3.

With the falling window, FBMKLCI is testing first support level at 1475 with subsequent supports at 1463 and 1423.

For a long term perspective,the current downturn has not reached its target of double top formed since early of the year.Based on the height of the double top the target is 1350.

Wednesday, August 17, 2011

Cap by 50% Fibo Retracement

R3

1519.95

R2

1515.25

R1

1506.74

Pivot

1502.04

S1

1493.53

S2

1488.83

S3

1480.32

Open

1502.21

High

1504.63

Low

1,499.59

Close

1,503.07


On Tuesday FBMKLCI was met by 50% FR while today the index formed an IB. With no touch on Tuesday the index is expected to retract toward the 5d MA. If will be comfirmed if the index fall below today's low.

Monday, August 15, 2011

Gains in Asia

Retail investors have been a net seller in local bourse for four straight week with foreigners have been a net seller for the last three weeks.

Yesterday FBM KLCI registered a rise of 1.08% in line with gains of regional bourses such as Hong Kong’s Hang Seng Index jumped 3.26%, Taiwan’s Taiex rose 2.39% , Japan’s Nikkei 225 up 1.37% , the Shanghai Composite Index gained 1.30% and Singapore’s Straits Times Index edged up 0.84% to 2,874.40.

FBM KLCI were lifted by institutions buying of blue chips that pull the index to almost to 1500 level.

Yesterday, the index close above the 5d MA, the first time since the last 10 days. With the market at overly oversold position there is a sign of immediate strength a at around 1500 level with prices moving along the 5d MA unless bad news emerged from the West.

FBMKLCI stability

Last week high volatility in the local bourse were accompanied by increasing volume traded. Before the sharp fall of FBMKLCI volume traded has been decreasing despite the index has moved from a low of 1474 in late February to July 11’s high of 1597.

I could inferred that the uptrend since February was not collective i.e. selective. The hard drop since mid July was precipitated in early August by high volume indicated support buying by government fund.

Most analysts expected next week will be a volatile but I see it differently as on Friday with strong support FBMKLCI registered a gap up and forming a small gravestone doji. The index has been on “no touch” of 5d MA for the quite a few days and only on Friday it almost reversed the situation. The coming week I foresee the index to tag the 5d MA moving within a much narrow range than previously.

If the high volatility did happen again due to US and Europe economic factors, the index will test the recent low of 1472.

Wednesday, August 10, 2011

Tagging The Dow

On Monday, The Dow dropped a massive 633 points, its largest percentage drop since December 2008 and the sixth largest point drop in the history of the index.

The overnight fall for the Dow was followed by 24.85 points loss for FBMKLCI on Tuesday. .

The low for today found support at 50% FR (1420).

At New York, on Tuesday the Dow swung to its best single-session percentage gain in more than two years.

Consequently, today FBMKLCI recorded a higher close after three straight days with a lower close.

With 50d MA crossed 20d MA from above and prices well below the 200d MA it seem that FBMKLCI is very susceptible to any development in New York.

Any pullback from current downtrend needed a positive market development of New York bourse.

Monday, August 8, 2011

One week lost of RM65 Billion.

The local bourse lost another RM33.76 billion in value today after the FBMKLCI fall below psychologically crucial 1,500-level and its intra-day low fall of 1476.24 almost touching current year low of 1474.38. The current total market capitalisation of Bursa Malaysia is about RM1.27 trillion. From last Monday, the market capitalization has reduced by RM65 Billion.

FMBKLCI within one month have fall to almost the year’s low from the year’s high.

For two straight day volume traded was twice the average 60 days volume with long and wide body hammer candles. This suggested that the market fall heavily in early trading of the day before buying mainly done by quasi government bodies an attempt to prop-up the market.

Noting that all short and intermediate MAs are negatively slopping and the 20d MA is trying to cross over the 50 MA from above any attempt for market recovery is a hard sell.

With all the external negative factors affecting the local bourse, the index need to stabilize. The market is currently at the strong support level of 1475-1480. The immediate resistance is at 1540 the 50% fibo retracement (FR).

Sunday, August 7, 2011

Lower for 4 straight weeks

R3

1558.52

R2

1555.72

R1

1551.30

Pivot

1544.51

S1

1544.08

S2

1541.28

S3

1536.86

Open

1529.94

High

1529.94

Low

1,509.37

Close

1,524.43


A massive gap opening on Friday, with FBMKLCI falling for straight 4 weeks. The first occurrence of four straight weeks with lower closing since market upturn in early 2009.

On the weekly chart, the index has been falling with increase volume traded. Having close below the 30 week MA, and the MA with a slight negative slope the outlook for Bursa Malaysia is not that promising.

The coming week, expected the index taking a breather with is oversold position. The psychological support of 1500 could be easily breach by next week or so. I am betting the index to get a strong support at 1475 level.

Rebound at 1500 might end at 1560 area setting up a possible head and shoulder pattern.

Friday, August 5, 2011

Filling the Gap


R3

1560.62

R2

1555.05

R1

1550.08

Pivot

1544.51

S1

1539.54

S2

1533.97

S3

1529.00

Open

1546.87

High

1552.91

Low

1,545.69

Close

1,546.89


FBMKLCI moved strongly the first hour of opening moving higher toward the mid point of R1 and R2. It slip down and went flat before succumbing to selling pressure after lunch break to go lower of the day at above pivot. It closed near the day’s low forming a doji with long upper wick. The close is just below the long term down trend line

It clearly indicated the market is pushing to fill the gap but not forceful enough to do it.

With New York performing badly with the Dow Jones falling 4.3% and to the lowest close since Dec 9 2010, Friday market sentiment look bleak.

A weak performance on Friday will cause the 20d Ma to cross over the 50d Ma i.e. dead cross that will saw the market sentiment for the immediate term turn bearish.

Wednesday, August 3, 2011

Gap

PpR3

1563.44

PpR2

1561.14

PpR1

1557.99

Pivot Point

1555.69

PpS1

1552.54

PpS2

1550.24

PpS3

1547.09

Open

1549.49

High

1549.49

Low

1538.95

Close

1545.10


FBMKLCI open lower than yesterday close with a wide gap just below S2. It sagged below S3 in morning session before recovering by lunch time. The bearish candle form a gap bar, a second gap within six trading days.

The two gaps that formed recently is similar to the two upward gaps that occurred in mid June (see the oval shaded area).

With all the three MAs having a negative slope, the market is expected to register a further fall but in the immediate term I am waiting for the 20 Ma to cross yhe 50 Ma that will indicate the market is moving toward a bearish tone.

Stalling Economy

PpR3

1570.25

PpR2

1564.37

PpR1

1561.19

Pivot Point

1555.31

PpS1

1552.13

PpS2

1546.25

PpS3

1543.07

Open

1558.02

High

1558.84

Low

1553.39

Close

1554.85


FBMKLCI open above pivot point and at previous day close. It went up but just below R1 before stumbling down above S1. It close lower than open to register a small bearish candle. Yesterday candle is also a NK7.

With the index inability to cross over the 10d MA for two straight day and flat to negative slope for 50d MA, the index is being pressure for downturn.

Fundamentally, regional bourses have move away from worrying about U5.S. debt woes and are more concerns about a sluggish economic situation.

Major global stock markets stumbled badly, while gold hit a record high, as a report showing U.S. consumer spending fell unexpectedly in June for the first decline in nearly two years as incomes barely rose.

That followed data on Monday showing manufacturing activity stalled in July, which mirrored similarly weak reports from Asia and Europe.

Tuesday, August 2, 2011

Optimism on the Dollar


Optimism that U.S. lawmakers will reach a last-minute deal to raise the government's debt limit and avoid a default push the USD upward.

EURUSD (eu) fall to 1.42 level during New York session yesterday. By early Asian session today, eu has inched up to the 38.2% fibo retracement. On the 30 MTF chart, eu is expected to move sideway with downward bias as the BB is constricting and the 21 MA hovering flat above the price.


The first eu trade is at bar A with an OB, 1st TP done at 1.42419 and SAR at bar B with indy's at extreme bottom.

Take a second entry for sell at above bar B, 1st TP (1.42727) was not reachable abandon the position after the fourt bar with twice OB pattern.


The gap is filled


PpR2

1557.93

PpR1

1553.37

Pivot Point

1549.27

PpS1

1544.56

Open

1549.79

High

1558.49

Low

1549.43

Close

1558.01


FBMKLCI posted a bullish candle with an open at above pivot point and reached a high just above the Pivot R2.

The Bullish candle managed to covered the gap that was formed on previous Thursday. The bullish pullback met resistance from the 10d MA and uptrend line.

The pullback is also accompanied by lower volume as compared to the previous week. Any effort to move further upward required strong volume to overcome the negative slopping 20d and 50d MAs.

The 10d MA has cross over from above the 50d MA last week indicating weakening market. The pullback could retest the 50d MA for the second time and failure could be costly.

The previous downturn of the index registered a fall of 3.7% that occurred in early April and lasted for one month.


Live Economic Calendar Powered by the Forex Trading Portal Forexpros.com