Most of the Asian market was closed with the exception of the Japanese due to the Chinese New Year.
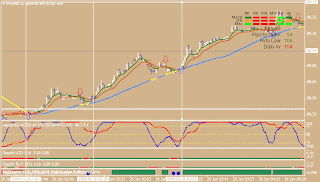
See the 15 min chart of USDJPY below.
Last week, by the end of the session, USDJPY was consolidating at around 88.80 to 89.00. It opened this morning, with a large gap of 40 pips and straight down to the lower of the Bollinger band. Support was provided by an uptrend line (the red line) and 76.4% retracement of the previous swing of high and low. Bottom was form with a morning star doji. An inside bar pattern was also formed. By 2:00 GMT price when above the lower Bollinger band and approaching the 20 SMA with a long body candle. This I could presume that the price is moving up to at least to the daily pivot point of 88.81 or to fill the gap. The daily pivot point is about equal to the 50% retracement.

Base on the 15 min TF analysis, my 1 min TF trade will be on the bull side i.e. looking for entry for a long trade. I made two long trade entry at 2:30 and 3:25. The chart below showed the trades that I took. At 3:05 and 3.15 there is a crossing of 6 ema over 12 ema from the top indicating a short trade. I did not take the trade since the Stealth LCD and the FXprime filter are still in green color. Furthermore, price is below the 20 sma with Bollinger band getting narrower indicating a trend consolidation and with a short entry our profit will be just a few pips. The 60 ema provide a support and the ema had only crossed the 200 ema from below 10 bars ago. As I mentioned in the previous posting we should beware for any entry if both the 60 ema and 200 ema is closed because possibility price going sideway.


