Saturday, January 31, 2009

Bad US GDP figures

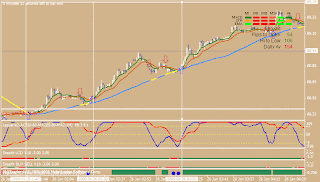
Today is the last trading day of the month and traders are squaring back their profits and positioning themselves for next week.  USDJPY actions can be separated into two parts; 1) the Asian session up to London open and 2) London open up to current i.e 20:00 GMT. During the first part USDJPY was down trending under the trend line AB. The cross fall from 90.14 to 89.17. At 8:30 GMT a piercing candle pattern was form signifying a reversal to uptrend. The uptrend moved within the C1C2 –D1D2 channel. I expected this uptrend will touched above the 90.00 and forming a nice and proper  “V” shaped pattern for the day. 

Key economic releases in US continue to show that the current recession will is at least as bad as the recession of the early 1980s. GDP showed a smaller than expected declines but nonetheless the largest contraction since the recession of the early 1980s. The Core PCE came in weaker than expected but showed slight growth. The Chicago PMI dropped below the 34.9 expectation to 33.3, just below the lowest reading reached in 1999 following the collapse of the dotcom bubble. Consumer Confidence also proved weaker than expected at 61.2, economists had expected 61.9. The reading is well off the 55.3 low reached in September but is a stark reminder that conditions remain negative and further downside will continue well through much of 2009.

No major reaction has been observed in currency markets following the releases although US stock  Markets are visibly down with the Dow 30 showing a greater than 1% decline.

In my 1 min TF trade, I try to took advantage in the uptrend channel of USDJPY. When cross reached the upper channel, I enter a short position and a long position when the cross touched the lower channel. The first entry is when the cross touched the upper channel at 12:00 GMT. At this juncture, the cross is above the BB and 38.2% fibo retracement. RSI is at overbought level with the blue lag is stuck above 80 level and the red lag is approaching the 80 level. A hanging man candles is formed after the previous candle touched the top of the channel. I took a short position with the target at 50% retracement-89.56.  or lower at  S1-89.44.

Price do touched S1 and formed a doji and later a bullish candle is formed to confirm the previous candle is a doji star, i.e morning star. With the reversal, a proper 4 point channel is now clearly define and trade could be enter at the top or bottom of the channel. 

Friday, January 30, 2009

The USDJPY at 90.00...again

Since the middle of December 2008, the currency cross of  USDJPY at 90.00 had been an important level of reference for support and resistance. This is partly due to the sideway movement of the cross as it is preparing for a possibility of double bottom.

Refer to 15 min chart below. From the left of the chart, on 29 January, 7:30 GMT USDJPY breached the 90.00, went to as high as 90.35. On the same day at 10:15 GMT, it pierced the 90 level from above to reach  bottom at 89.62 and than had a reversal upward to  barely breached the 90.00 level at 12:45 GMT. An evening star was formed and the cross inched slowly downward for 5 hours.

By the closed of the 29 January, the cross managed to touch the 90 level with a doji and expected shooting star but today open there was an opening bozu candle and closed above the daily pivot point. Two candles later or 30 minutes, a reversal signal of evening star was formed just beneath the 23.6% fibo retracement. The cross cut through the 90 level, the daily pivot point and  the uptrend line with possible target at 38.2%  retracement at 89.85 or 50% retracement at 89.55. 

Thursday, January 29, 2009

USDJPY at 90.00

USDJPY went flat in late Asian session before became volatile during the first 2 hours  of European session. The cross managed to lumber above the daily and weakly pivot point when 200 EMA was seen moving horizontally flat with 60 ema edging slowly upward above the 200 ema. The cross showed a slow ride on the bullish side as the high posted a higher  high than the previous high and the low posted a higher low than the previous low. 

The setback for the cross to move further upward was the resistance level of the early morning high of the Asian session at 89.45. That resistance level was tested one hour before US open i.e. 13:00 GMT. Subsequently the cross fall back to the 23.6% fibo retracement with a hammer candlestick. Than a doji candles is formed followed by spinning top and a bullish buzo. The next two candles, the open gap up from the previous candle close. By this time i.e 15:00 GMT I am considering to enter my scalping of 1 min TF with an upside bias and breaching the resistance level of 89.45. Note: during this time, the three moving average i.e. 20 sma, 60 ema and 200 ema is sloping upward with the cross steadily moving upward. 

On my 1 min chart, at 16:59 GMT the 6 ema cross the 12 ema and both ema’s are above 50 sma with a bullish Stealth LCD and Stealth  Buy & Sell filters. I entered long with my profit target at  resistance R1 at 89.87 or the psychological level of 90.00.  Profit is about 50 pips.

Wednesday, January 28, 2009

Fibonacci Retracement.

In forex, the fibonacci (fibo) ratios  are used extensively to calculate resistance and support. Fibo level are reliable as a large number of traders use them, and when this happens the traders, in mass, drive the prices to these levels. 

From yesterday swing high of 90.06 to a swing low of 88.42, USDJPY currency cross retraced to fibo 61.8% at 89.46 (24:00 GMT or one hour after Asian session opened). On 15 min TF, the RSI and lag indicators and BB was at overbought position. (refer to the chart above)

For 1 min TF trade, the 61.8% fibo retracement  act as a resistance, and a reversal of trend is imminent.   

The  1 min chart 2 below showed that  BB and RSI was at extreme point at 00:10 GMT and we are looking for a short entry.

 At 00:21 GMT, the 6 ema cross from above the 12 ema (chart 1 below) with Stealth BUY & SELL filter showed a red color indicating for us to initiate a sell of USDJPY. Our profit target will be at 23.6% retarcement-89.25 and 38.2% retracement-89.04 of the swing low at 15:15 GMT to swinh high at 24:00 GMT. At 00:33 GMT the 50 sma cross both the 6 and 12 ema to reconfirm that the currency cross is bearish. 

The second profit target was reached and our profit is 34 pips (89.37-89.04). With just one trade I have achieve my objective of having 30 pips profit per session.

                                             Chart 1
                                             Chart 2

US Consumer Confidence

USDJPY was on the uptrend from the Asian opening up to London opening. Than it was a sharp reversal downtrend that takeaway all the gains it garnered during the Asian session within two hours of trading in London session. It recovered to the 38.2% retracement but  there is a indication of  market weakness as the downward sloping 60 ema contained price uptrend. USDJPY was ranging at a tight range of 20 pips for the first two hours of US session.


By 15:00 GMT or 10.00 am New York time, there was a report  on US consumer confidence that dipped further in January, falling to a new low at 37.7 from 38.6 in December. The report caused a weakness in some major currency crosses but a few of the traders attributed the weakness to a large EURJPY selling. The fall in EURJPY set the ball rolling to the downside just after the 15:00 GMT options expiry. Some surmise the selling was from model funds as many models reset daily at 15:00 GMT, a period of maximum market liquidity under normal circumstances.

USDJPY  fall was supported to a level of  88.52 (horizontal red line).  A morning star candle is formed outside the Bollinger Band (BB). The oversold is also reflected by RSI level below 30. One hour after the New York open i.e. 14:00 GMT I decided to enter the market with a bias on the upside since the 15 min sharp fall is just a temporary jerk downward and a reversal upward to at least the daily pivot point-89.00 is overdue. I  took two long entries at 15:51 and 16:44 GMT

                                             1 min chart of USDJPY
                                             15 min chart of USDJPY

Tuesday, January 27, 2009

Return of the risk appetite?

The market was looking  for a reason to disregard  its risk aversion  mood and found in a better than expected US home sales, Barclay Bank positive earning forecast with no further fresh capital injection and a major takeover in the drug industry (Pfizer over Wyeth) yesterday. 

The risk aversion index VIX has fallen for four days in a row to 46, but need to go below 40 before sentiment turnover can be inferred. 

Major currencies strengthened against the US dollar and Japanese yen. The USDJPY was bullish during Asian session and carried all the way to European session. As European session end and lunch time in US, the USDJPY weakened by falling from the day high at 89.67 to the low of 88.84 at 20.00 GMT. The cross went sideway at 23.6% retracement from the previous swing high to low…between 89.00-88.90 level. 

Today open, the USDJPY fall below 89.00 level and the uptrend line ( red line), with yesterday daily pivot point and the lower Bollinger band become a support level. Than it reversed upward creating a bear trap. 

Subsequent moved upward were impressive penetrating the daily and weekly pivot points, and the three moving averages. At 2:00 GMT, one hour after Japanese session opened the cross has reached  68.2% retracement. At this time about 9.00 Malaysian time, I decided to enter with a long trade bias. The target is at 76.4% retracement at 89.50. 

I entered long at 2:13 GMT and closed at 89.40. Almost near to the 76.4% retracement. At 2:46 GMT the 6 ema cross 12 ema from above indicated a short position, with 76.4% retracement almost within reach, I decided to short USDJPY. By 2:57 GMT both ema's fall below the 50 sma confirming the reversal to short term downtrend. The target will be the 200 EMA.


US home sales jump in December

At  15:00 GMT , a better home sales data was reported. The pace of sales of existing homes in the US unexpectedly hastened last month, as bargain-hunting buyers were lured back to the market. 

After a swing of low to high during the European session, USDJPY currency cross find support at 50% retracement, a downward trend line(red line) , upward sloping 50 ema and the psychological level of 89.00..

An inverted hammer candle is formed at 15:30 candle with prices almost 20 pips above daily pivot point, a reversal of trend is expected. The target price is at daily resistance R1 at 89.62. 

I trade at 16:00 GMT one hour after the existing home sales report  with two long entry i.e. at 16:04 and 16:52. Profit earned 42 pips


Monday, January 26, 2009

Happy Chinese New Year

Most of the Asian market was closed with the exception of the Japanese due to the Chinese New Year.

See the 15 min  chart of USDJPY below.

Last week, by the end of the session, USDJPY was consolidating at around 88.80 to 89.00. It opened this morning, with a large gap of 40 pips and straight down to the lower of the Bollinger band. Support was provided by an uptrend line (the red line) and 76.4% retracement of the previous swing of high and low. Bottom was form with a morning star doji. An inside bar pattern was also formed. By 2:00 GMT price when above the lower  Bollinger band and approaching the 20 SMA with a long body candle. This I could presume that the price is moving up to at least to the daily pivot point of 88.81 or to fill the gap. The daily pivot point is about equal to the 50% retracement.

Base on the 15 min TF analysis, my 1 min TF trade will be on the bull side i.e. looking for entry for a long trade. I made two long trade entry at 2:30  and 3:25. The chart below showed  the trades that I took. At 3:05 and 3.15 there is a crossing of 6 ema over 12 ema from the top indicating a short trade. I did not take the trade since the Stealth LCD and the FXprime filter are still in green color. Furthermore, price is below the 20 sma with Bollinger band getting narrower indicating a trend consolidation and with a short entry our profit will be just a few pips. The 60 ema provide a support and the ema had only crossed the 200 ema from below 10 bars ago. As I mentioned in the previous posting we should beware for any entry if  both the 60 ema and 200 ema is closed because possibility  price going sideway.


Saturday, January 24, 2009

Yen Intervention


On Wednesday (21/1/09) the dollar fall heavily  against the yen due to expiration of  dollar/yen option position at 90 and without being exercised at 10.00 am New York..

The position had been defended by buying dollars against the yen but with the expiration, the holder no longer had to buy dollars but rather wanted to sell them, pushing dollar/yen to a session low. The Holder an an institution in question pulled the bid at 10.01, a 3% plunge down the elevator shaft swiftly ensued, taking USD/JPY down to its previous low of 87.10. 

It was rumored that the 90 yen option position was traded for $5 billion.

Dollar selling against the yen spilled over into EURJPY with the single currency falling to its lowest level since March 2002.

It was rumored that the 90 yen option position was traded for $5

Intervention rumors swiftly ensued, though USD/JPY subsequently squeezed higher along with US equities. But still, it would be quite a statement for Japan to intervene in currency markets in week one of the Obama administration.

Looking at a USD/JPY daily chart above, the retracement  from the November highs to the December lows, we see the Yen ripped down to just below the lows made in December above the 87 handle. The pair rebounded to the 23.6% retracement level and has since traded lower.

A possibility of double bottom is forming, but a hard break below the 87.00 level will caused a further slide down.

But will the USDJPY slide any further? 

Not likely, according to  Bank of New York Mellon currency strategist Neil Mellor.

He said that because of the market's fear of currency intervention, the yen's gains may soon come to an end. Mellor also said the possibility of the BOJ intervening is very real and that the chances of intervention will rise significantly should the cross fall below its monthly low. On Jan. 19, former ministry official Eisuke Sakakibara told CNBC that Japan would intervene if the currency falls below the 85.00 level.

Friday, January 23, 2009

My trade on Thursday 22/01/2009 at Asian session

The us dollar tumbled to 87.10 against the Japanese yen, the lowest since 1995, on active cross buying in JPY after the expiration of sizeable options with strike price at 90.00 in New York session, however, dollar rebounded in late trading to around 89.50 on speculation that Japan's Ministry of Finance would intervene in the currency markets to curb the yen's ascent.
At that price there is a strong a resistance of 76.4% retracement from yesterday sing high and low. The resistance is quite strong and determine the bearish trend in early Asian season. Price also detected under the influence of downward sloping 200 ema with 60 ema showing a flat move from the late US session.

Based on the 15 mtf, I could conclude that the general trend is down with a bias for sideayw moved, so my 1 mtf trade in the Asian session I favour taking a short position. See the 15 chart below.
I started at about 7.00 am Malaysian time or the opening time of Japanese session i.e at 23:00 GMT.

9 min after open the 6 ema cross 12 ema from the top, early indication for short entry. Price is also below the opening price. This is confirm by the filter Stealth BUY and SELL, and Stealth LCD showing red in color. The fast lag (blue) has gone below 85 while the slow(red colour). Therefore by entry is at the close on the 1.09 bar which is at 89.34.

At 1.35 the Stealth BUY and SELL indicated a green colour, with 6 ema cross 12 ema from below. Does it indicate a reversal? I defer the decision to the Bollinger band. It seem that price is reaching the mid point of the band with 20 sma sloping downward. There is a resistance from the downward sloping 200 ema(red line). The band is getting narrower as the 60 ema approaching 200 ema from the top. It clearly indicate a continuation of bearish trend. I am targeting a 30 pips profit target as subsequently the 60 ema cross 200 ema from above which indicated to take a long position will be a risky endeavour. Closed my position at 88.97 at 1.57 for a profit of 37 pips. Meet by objective of 30 pips profit per session. So within 45 mins trading I met my profit target and stay out after that.


Thursday, January 22, 2009

My Trading System

My forex trading sytem is to trade on 1 min time frame using two systems: FX prime initially developed by Canadian Dude and Scalping using lag indicator by Imrait Sait at Forex Factory Forum. Due to unfortunate circumstances both threads have been placed in the recycle bin and the two of them are banned to participate in the Forum.

The basis of the two systems has been explained in my previous postings. Imrain Sait rely on the lag indicators, the 60 and 200 EMA, pivot point, MACD, stochastic histogram and Bollinger Band. Canadian Dude’s FXprime initially based on CCI indicators but further development by contributors in the forum it is more on moving averages cross and technical filter known as FXprime filter that incorporate CCI, RSI and stochastic. The system basically relies on the cross of 6 and 12 EMA and 50 SMA. A smoothed Heiken Ashi indicator is also employed for exit.
I combined both systems to determine my entry point. Basically it is the cross of 6 and 12 EMA. As I trade in 1 min time frame, i checked the general trend by scanning through the 15 min TF and 1 hr TF. The lag indicators are used to determine either the market is overbought or oversold.

My exit is based on price pattern, price position on the Bollinger Band, support and resistance especially at pivot point.

My stop loss is set 10 pips at entry with target price at 20 pips or more if entry is trend trade. For counter trend i take what the market give...sometime as low as 5 pips.

Currently, I only concentrate at one currency cross only; USDJPY. Since my trading style is scalping with 1 min TF, my concentration to trade USDJPY in early Asian session-23:00 GMT to 02:GMT and during New York morning session i.e. 12:00 GMT to 16:00 GMT.
I normally avoid trading 30 min before and after major news.

My target is make 30 pips per session or 60 pips per day.

Sunday, January 18, 2009

US New President

As expected USDJPY retreated and reached the 88.50 support last week.. The whole week USDJPY moved below the 50 EMA and the weekly pivot point. (refer to the 4 hr TF chart below ).  The low was supported by the Weekly S1.

Subsequently after reaching bottom, USDJPY crossed the downtrend line with RSI and lag showing a positive moved upward and find support at 50 EMA.

Fundamentally, most of the week the yen strengthened not only against the dollar but also other currencies as traders became more risk averse and aggressively sought the safety of the lower-yielding Yen. The Yen strength caught traders by surprise. For weeks, investors had been anticipating an intervention by the Bank of Japan. The Japanese government has been putting pressure on the BoJ to take aggressive action since each rise in the Yen is eroding exports and triggering corporate losses.

Investors became more optimistic about US equity markets late in the week after Congress released the last third of the TARP money and the U.S. government bailed out the financially strapped Bank of America.

The strong rally in the USD JPY is an indication of a strong start next week.

Traders may drive up equity markets in celebration of the inauguration of Obama. This may trigger more selling in the Yen. This could bring optimism to the market which could increase trader appetite for risk.

The USD is expected to start off slowly with holiday in US but volatility will continue to build up as the week goes. Development in global stocks remain the main focus. In addition, markets will also pay much attention to BoC which is expected to cut rates by 50bps to 1.00% on Tuesday.

Nevertheless, upside is expected but  to be limited by 91.52 resistance (50% retracement of 94.61 to 88.47). At this level the 200 EMA will exert resistance pressure. 

Sunday, January 11, 2009

USDJPY ...a reversal


The US dollar which showed some strength against the yen started to sag by Tuesday, Jan 6th.
The drop of the dollar for the last three days last week was quite heavy that it is now resting at 61.8 correction. Technically, the USDJPY was at overbought level on RSI and the lag (the fast(blue) and the slow(red)).
The price tagged the upper channel of BB showed a candle reversal (dark cloud cover) and moved rapidly downward, breaching the 20 SMA, the flat 200 EMA and uptrend support line (L1).
USDJPY closed at 61.8% of the swing low to high, 38.2% of the swing high to low and support line L2.
Next week, USDJPY is expected to test the 90.00 level wih further support at 88.50 level.

Third Indy...The BB

As mentioned in my last posting, moving average is a momentum technical indicator which could identify trending market.

To determine that the currencies are setting properly in the trending market, I utilized three moving averages; 20 period SMA, 60 period EMA and 200 period EMA. The three moving averages should be in a proper order in and uptrend and downtrend.

For up trending prices;
1. prices are above the 20 SMA
2. 20 SMA is above 60 EMA
3. 60 EMA is above 200 EMA

In the event of downtrend, the proper order should be as follows;
1. 200 EMA is above 60 EMA
2. 60 EMA is above 20 SMA
3. 20 SMA is above the prices.

The usage of 50 SMA the previous post) and 60 EMA give me an indication of a rallying point for a price to remain either below or above it at 1 and 5 min time frame. In a downtrend prices are always below the 50 or 60 moving average and in the uptrend prices tend to remain over it. Once the 60 EMA crosses the 200 EMA from below going up, it give us confirmation of a bullish mood. On a 1 min time frame chart, the golden cross could netted a 30+ pips moved to one direction, and vice versa for short moved.

The 60 EMA and 200 EMA acted as support and resistance and usually prices come, touch it and bounce back, indicating that it is a strong level to buy if if it is in a uptrend and sell in a downtrend.

The 200 EMA is a more powerful moving average and it is like a barrier which prevent prices from breaching it, and if it is breached, price can come home with a 50+ pips in the direction of the change.

Currencies or forex market is a volatile market. This volatility move in cycles, in other word, period of high volatility tends to be follow by period of low volatility. A high volatility in a higher time frame will showed a up and down prices movement in the lower time frame i.e. trending upward and downward while low volatility will be a consolidation of prices at a tight range.

In the chart below, on the left of the chart i.e 19:30 to 29:00 there is a low volatility with prices moving sideway. Many traders used moving average to indicate volatility. During this period the 20 SMA(green) and 60 EMA(blue)moved sideway as prices consolidated before the uptrend. After a golden cross of 20 SMA and 60 EMA prices moved upward to test the 200 EMA(red) which clearly showed the alternative prices volatility from low to high. This volatility is captured within the .the Bollinger Band (BB).

The Bollinger band tries to identify periods when prices is overextended. If prices touched the upper band it can be considered overextended on the upside or overbought, and on the other hand, if prices touches the lower band the prices is overextended at the bottom or oversold. Note: during a trending market these technique is not applicable. At the chart from 20:22 to 20:40 prices stayed within the upper band and the central moving average-20 SMA therefore prices closed above the upper band in the uptrend are not reversal signal. A trader should wait for the price to turning the opposite direction after touching one of the bands before considering that a reversal is happening. It is better still if prices closed below the 20 SMA for indication of reversal. In conjunction with other indicators we can alos identify potential reversal points.

One of the other great advantages of Bollinger bands is that they adapt dynamically to price expanding and contracting as volatility increases and decreases. Therefore, the bands naturally widen and narrow in sync with price action, creating a very accurate trending envelope

Bollinger bands (BB) help us to measure a market’s volatility. Basically, BBl tells us whether the market is quiet or whether the market is LOUD! When the market is quiet, the bands contract; and when the market is LOUD, the bands expand. Notice on the chart below that when the price was quiet, the bands were close together, but when the price moved up, the bands spread apart. . When the bands “squeeze” together, it usually means that a breakout is going to occur. If the candles start to break out above the top band, then the move will usually continue to go up. If the candles start to break out below the lower band, then the move will usually continue to go down.

Thursday, January 8, 2009

Moving Average Cross my second indy

Technical Analysis(TA) indicators are are mainly divided into two separate groups: oscillators and momentum indicators: the former try to predict a future change in trend, while the latter help assessing whether a trend that has already started will either continue or revert.
Some of the most widely used oscillators include:
-Stochastics: an oscillator that indicates whether the market is currently in an 'overbought' or 'oversold' phase. When the stochastics graph goes beyond a certain threshold, investors' reactions are usually to sell (overbought) or buy (oversold).
-Parabolic SAR: helps identifying the end of a trend in a timely fashion on a bearish or bullish market. It is plotted on the candlestick graph, and where the index crosses the candlestick graph itself, this is generally a seen as a symptom of a trend change.
-Relative Strength Index (RSI): similarly to stochastics, indicates the strength of the current trend on a scale from 0 to 100 — 0 to 50 for bearish, 50 to 100 for bullish.

Some of the most common momentum (or lagging) indicators include:
-Simple Moving Average(SMA): average value of the last n candlesticks, where n is a configurable parameter.
-Exponential Moving Averages(EMA): similar to the simple moving average, but the most recent data has a much stronger influence over the value of the index, which means this indicator is much more sensitive to changes in value.

My second TA indicator in my daily analysis of forex is a momentum indicator: moving average.
Moving averages (MA) are the oldest and simplest indicators in trading. In times when there were no computers the easiest way to visualize the price movement was to plot them on chart. Computers turned moving averages into a powerful tool for technical analysis that is used in many different trading systems.
There are many types of it but the most widely known ones are Simple Moving Average (SMA), Exponential (EMA) and Weighted (WMA).
The main rule of trading with moving average is to look for the price to cross it. If price crosses below the moving average then it is the signal to sell the currency pair. If price crosses above the moving average then it's the signal to buy the pair. The period of averaging plays a significant role in generating trading signals. If period is small it will give high number of signals most of them will be false. But if the number of period is too high then such moving average will be too lagging and giving the signals too late.
In the market when trend changes frequently going through consolidation phases trading system based on one moving average may not give very satisfactory results. It is necessary to employ some sort of filters. But moving average itself is a good filter.
The trick is to use two different periods of averaging. The shorter period curve will change quicker with the price while the longer period curve will be slower and filtering out the false crosses of the price.
What are the best Time periods?
This of course is all down to personal preference and to a degree how volatile the market is you are trading. My own view based around my experience trading in stock and future market and reading though available information in the net , for a short term trading I prefer to use 6 and 12 period EMA, 20 period SMA,50 period SMA, 60 period EMA and 200 period EMA.

The main principal of my TA in utilizing moving average, is the crossover of 6 and 12 EMA. The trading system will generate buy and sell signals based on these crossovers. Generally a buy signal is generated when 6 period EMA cross above 12 period EMA; and a sell signal is generated in opposite situations. Confirmation of the entry is when both 6 EMA and 12 EMA cross the trend confirmation moving average, the 50 period SMA. The 50 SMA indicated an immediate term trend direction. When prices, the 6 and 12 EMA is above 50 SMA our trade position should be in the long side and vice versa.


Refer to the chart above. The arrow indicated when the 6 EMA (magenta col0r) cross 12 EMA (green color), with the arrow downward (magenta) indicating 6 EMA cross 12 EMA from above (i.e. sell) and the blue upward arrow indicating the 6 EMA cross 12 EMA from below (buy).
The 50 SMA is colored both blue and yellow. A blue color indicated that RSI is above 50 while yellow is below 50.
As stated before that moving average is a momentum indicator, when prices consolidated the moving average crosses signals did not cleanly showed for our entry(Note: on the chart at the end of the period the prices went sideway with the crosses showing false signal). Therefore we need to know when the prices will be trending and when it will consolidate or ranging. To identify it, i utilised the Bollinger band and using the 60 and 200 EMA. The 60 and 200 EMA is also used to identified support and resistance. This subjects will be explain later.

Tuesday, January 6, 2009

First Indy...The Lag

One of the technical indicator that i loved to apply in my everyday trading is the laguerre RSI. Laguerre RSI simply known as lag was introduced by John in his book “Cybernetic Analysis for stocks and futures”. It uses a lag filter to provide a “timewrap” so that the low frequency components are delayed more than the high frequency components, enabling much smother filters to be created using less data.
Normally I overlay two lag indicators one on top of the other and change the settings on the second one which I used as my trend indicator.
Below is 1 min USDJPY chart showing the 2 lag indicators overlayed. The red lag is the fastest setting lag and the blue is the slower setting lag. The orange line on the chart is the lag filter line with the same setting as the blue or fast lag.

The settings are as follows:
Inputs: Gamma 0.8 (red or slow lag), 0.55 (blue or fast lag)
Levels: 0.85, 0.45 and 0.15
Filter line setting gamma: 0.55
The filter line creates a good visual aid to enter a trade as it easy to see when the bars open above or below the filter line. As the gamma setting on the lag filter line is the same as the blue lag indicator, the candles cross above or below the filter line at the same time.

The chart show that at 2:21 the fast or blue lag crosses below the 0.85 level and the candles open below the lag filter as we go short. If the fast or blue lag cross from zero above the 0,15 level and the candles cross above the lag filter we get the signal to enter long.


Typically when there a strong trend in either direction the lag flatten at the top or bottom indicating that the trend is is in tact.
When the slow or red lag crosses above 0.15 or below 0.85 it generally confirms the long term direction.
Note: When the red slow lag is heading lnog and the blue slow lag crosses short this is most likely a pull back as the red line generally signals the overall trend.

Firts Full Day Trading Session

As I was trained in analyzing and investing in stock market early in my carrier, my preference time frame for investment has been as a long term trader. Despite the long term view, I don’t prescribe to the mantra of buy and hold strategy ala Warren Buffet, I am more of adopting the concept of market timing that is skewed to technical analysis than fundamental analysis.

In my current adventure in the fast and liquid forex market, I decided to be more as short term trader and most of my trades can be term as scalping i.e. holding my trade for a few minutes and within one day.

Although scalping is a high risk but is more enjoyable. Glue to a monitor for 2-3 hours might be boring proposition for some people but I am used to it. As a ex-equity/share  analyst and trader I am used to monitor shares price zigzag  between bid and ask prices  from 9 am to 5 pm.  

Much has been said about short term trader suffering from market tunnel vision. They are presumed to be watching one or two pairs of currencies in the short term and are unable to see what is happening in the rest of the market around them. As for me, I do take interest in the fundamental that are affecting the currency such as the economy of the country and the role played by the central banks. Analyzing the fundamental and deciding whether the market has factored the fundamental events into the prices make the process of forex analysis based on the technical tools much smother and easier. 


For the fast few months, through trial and error and sieving through info’s available in the internet I managed to device a trading plan or strategy  based on a few of technical tools. Although my trading plan is not a holy grail to become instant millionaire at least I am comfortable with it and I am confident that the plan can made some money.

For the beginning, I will concentrate on  four currencies pairs-EURJPY, USDJPY, EURUSD and GBPUSD.

Beginning, from today blog, 2009  first full day of post-holiday trading of forex,  I will make an effort to post my analysis and the position I took.


Early morning I was quite busy and the only time that I could be in front of computer was at about 5pm(Malaysian time). By that time London has open and I managed to have a look at few of the pairs and decided to trade the USDJPY. My comment is as follows: 


The greenback surges across the board in European session without any fundamental news behind it. The only news was reports that President-elect Barack Obama and congressional Democrats will push for a $775 billion stimulus package that includes as much as $300 billion in tax cuts that helped lift stocks,


On the chart, a pennant (ABCD) was formed with the base CD is the daily pivot point, When London open, USDJPY broke through 92.00 level. Today is expected to be bullish since last Friday, price breached  downtrend resistance line E. The uptrend coincides with breakout from the Bollinger Band squeeze and the blue lag moving above 15 level. (Note: the red lag is flat above 85 level indicating a bullish position). I entered the market at 10 GMT when prices are hovering at 93.00 level with my profit target at 93.40. At that level, there are two resistance level, the daily pivot point R2 and Fibonacci 1.618 extension from the swing low of 90.80 and the high of  92.41.

I used the 5 min time frame for entry and exist.

5 minutes after New York open, based on my 5 minutes time frame technical tools, I short USDJPY with my profit target of 20 pips.. I managed to close 30 mins later. With 60 pips in my bag I decided not to trade. With a few more hours before my bedtime, I surf the net for the news and trading commentaries. 


Sunday, January 4, 2009

Adios 2008

Well, it's been a wild year for 2008. I don't think anybody is going to look back at 2008 and say that there wasn't enough action.
For currency traders, whether you were a longer-term position trader or a shorter-term scalper, you saw plenty of price movement in the forex market this year.

For local stock market investors……it is a garbage year……but if you are a stock market index player…you could short the market and make a bucket of ringgits.

In my perspective the price movement of the major currencies can be summaries as follows;

The EUR USD closed the year with its first loss since 2005. The euros was badly beaten by the risk averse investors as the financial crisis escalated, investors started dumping higher risk assets including stocks and commodities and parking the money in the United States. Despite efforts to boost the Euro by keeping interest rates high, the European Central Bank started to cut rates late in the year as economic reports showed the Euro Zone economy weakening.
The big loser was the British pound. Investors aggressively sold the Pound as the U.K. economy sunk into a depression led by a terrible housing market and an extremely tight mortgage market. During the last week of 2008 the Pound made a new low against the US dollar for the year as traders positioned themselves for a rate cut down to zero early in 2009.
The Japanese Yen was the winner in 2008. The rally in the Yen was led by the unwinding of carry trades. During the stable years leading up to 2008, traders had been borrowing Yen at cheap interest rates to invest in risky assets. Once investor sentiment shifted toward risk aversion, traders quickly began to unwind their carry trades by buying Yen and selling Dollars and Euros.
By the end of 2008 the rally in the Yen hurt Japanese exports, weakening the economy and leading to losses from major automakers. At current levels, the Yen looks a little toppish as threats of intervention and a recent interest rate cut has curtailed the aggressive buying.

The bursa saham Composite Index went below its 50 and 200 day moving average since march 2008 which is an important indicator for me, indicating a bearish market since the first quarter of the year.

Is there a probability of a huge decline right after a huge decline?

That is where the stock market world is now. The market is wading through the aftermath of a huge decline climbing to the 50 day moving average by the year end, trying to sort it all out.

If we referred back to the last bear market in 1997, there was a huge decline followed by a rebound and than a subsequent huge decline before the market going through a long bull market that last until early 2008.

Most of Elliot Wave practitioner in Wall Street expecting a 5th wave of a 5 Elliot Waves decline with the current uptrend as a 4th wave correction in S&P 500 and Nasdaq. They are expecting a nasty decline of 5th Wave with a target back down approximately 600 on S&P 500.


Live Economic Calendar Powered by the Forex Trading Portal Forexpros.com